The data, from the First American Real House Price Index, measures home price changes, taking local wages and mortgage rates into account "to better reflect consumers' purchasing power and capture the true cost of housing." The June 2017 data is ranked by RHPI value, where a reading of 100 is equal to conditions in January 2000.

No. 12: Indiana
Real Home Price Index: 66.7
Year-Over-Year RHPI Change: 7.2%
*Home price data from Indiana Association of Realtors

No. 11: Missouri
Real Home Price Index: 66.4
Year-Over-Year RHPI Change: 3.2%

No. 10: Louisiana
Real Home Price Index: 66.3
Year-Over-Year RHPI Change: 8.1%

No. 9: North Carolina
Real Home Price Index: 66.3
Year-Over-Year RHPI Change: 6.2%

No. 8: New Hampshire
Real Home Price Index: 62.7
Year-Over-Year RHPI Change: 6.0%

No. 7: Oklahoma
Real Home Price Index: 61.4
Year-Over-Year RHPI Change: 3.6%

No. 6: Arkansas
Real Home Price Index: 61.1
Year-Over-Year RHPI Change: 2.5%

No. 5: Iowa
Real Home Price Index: 60.9
Year-Over-Year RHPI Change: 9.6%

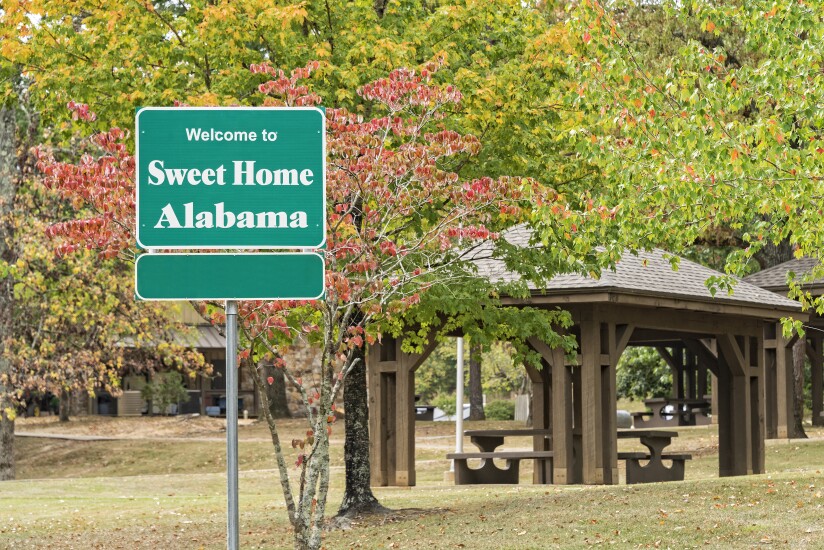
No. 4: Alabama
Real Home Price Index: 57.5
Year-Over-Year RHPI Change: 4.3%

No. 3: Nebraska
Real Home Price Index: 56.5
Year-Over-Year RHPI Change: 4.9%

No. 2: Kentucky
Real Home Price Index: 55.6
Year-Over-Year RHPI Change: 6.1%

No. 1: Ohio
Real Home Price Index: 55.4
Year-Over-Year RHPI Change: 8.7%


