While the difference between the denial rates for white and black applicants narrowed over this time period, the difference between whites and Hispanics and whites and Asians both grew, according to a Zillow study of
In 1996, 8.5% of white applicants and 16.3% of black applicants were denied FHA loans. In 2016, 11% of white applicants and 18.6% of black applicants were denied. Put another way, the denial rate for blacks did not increase as much as the denial rate for whites.
Meanwhile, the FHA denial rate for Asian applicants in 2016 was 15.3%, up from 10.1% in 1996, while for Hispanic applicants, there was a 14.8% denial rate in 2016 compared with 10.5% 20 years ago.
In 2016 the FHA denial rate among all minority groups was 14.4%. At the same time, the difference in denial rates between whites and minorities for conventional mortgages also grew over the same period.
"Mortgage approval data point to both progress and stubborn inequities in the American housing market," said Zillow Senior Economist Aaron Terrazas in a press release. "Black mortgage applicants are still more than twice as likely as whites to be denied, a visible legacy of historical discriminatory policies. For the large majority of home buyers, getting approved for a loan is the first step on the road to homeownership, and these continued disparities represent an ongoing barrier to housing and social equity in America."
Black households making the median income could only afford 55% of the homes listed for sale in 2017,
Here's a look at the 12 housing markets with the largest combined denial rates for black, Asian and Hispanic applicants. The findings are based on a Zillow analysis of HMDA data for the 50 largest metro areas in the U.S. Also shown is the difference between the minority denial rate and the denial rate for white applicants, shown in percentage points.

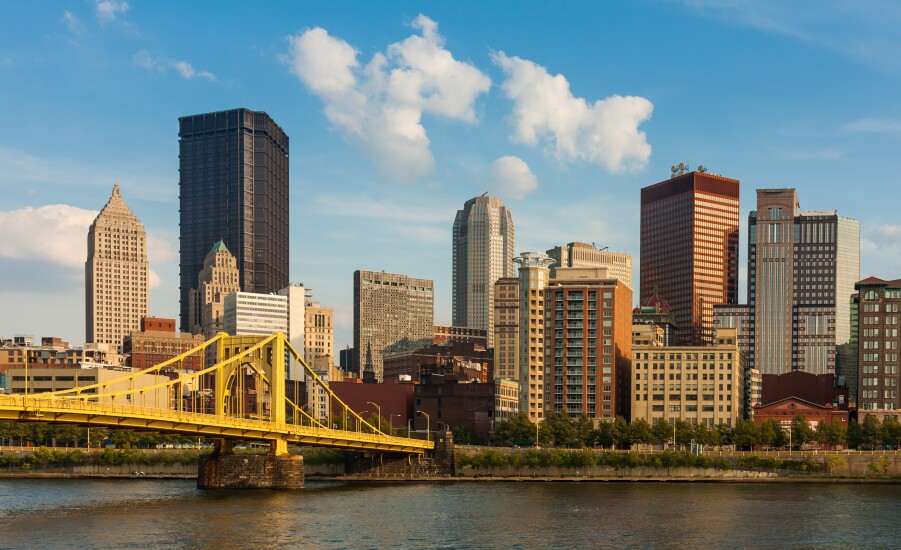
No. 12: Pittsburgh, Pa.
White FHA denial rate: 8.9%
Percentage point difference: 9.6
Total FHA denial rate: 10.5%

No. 11: Richmond, Va.
White FHA denial rate: 8.1%
Percentage point difference: 10.5
Total FHA denial rate: 12.7%

No. 10: New York, N.Y.
White FHA denial rate: 13.2%
Percentage point difference: 5.5
Total FHA denial rate: 17.1%

No. 9: St. Louis, Mo.
White FHA denial rate: 8.4%
Percentage point difference: 10.7
Total FHA denial rate: 11.1%

No. 8: Chicago, Ill.
White FHA denial rate: 12.1%
Percentage point difference: 7.3
Total FHA denial rate: 16.4%

No. 7: Columbus, Ohio
White FHA denial rate: 12.0%
Percentage point difference: 7.9
Total FHA denial rate: 14.6%

No. 6: Milwaukee, Wis.
White FHA denial rate: 9.6%
Percentage point difference: 10.6
Total FHA denial rate: 13.6%

No. 5 Orlando, Fla.
White FHA denial rate: 13.2%
Percentage point difference: 7.3
Total FHA denial rate: 18.6%

No. 4: Tampa, Fla.
White FHA denial rate: 13.5%
Percentage point difference: 7.8%
Total FHA denial rate: 17.0%

No. 3: Buffalo, N.Y
White FHA denial rate: 10.4%
Percentage point difference: 12
Total FHA denial rate: 12.5%

No. 2: Detroit, Mich.
White FHA denial rate: 12.6%
Percentage point difference: 10.1
Total FHA denial rate: 16.1%

No. 1: Jacksonville, Fla.
White FHA denial rate: 15.1%
Percentage point difference: 9.8
Total FHA denial rate: 18.7%


