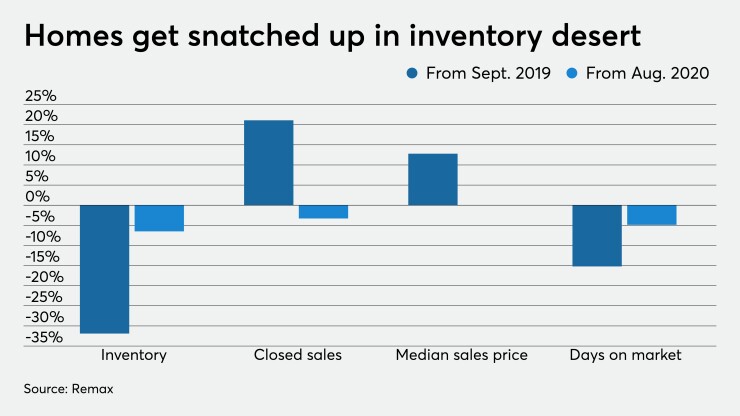
As record low mortgage rates drove buyer demand, home sales and prices spiked in September, shrinking the supply and days on market,
Housing inventory sank like a stone, falling 31.9% year-over-year and 6.5% from August to the lowest point in the 13 years of Remax's National Housing Report. National supply decreased to 1.8 months in September from 3.8 months the year prior.
Among the 53 largest markets, the lowest inventories were tracked in Boise, Idaho, at 0.5 months, Albuquerque, N.M., at 0.7 months and Manchester, N.H., and Omaha, Neb., both at 0.8 months. A 6-month supply defines equilibrium.

Closed transactions played a major factor in the shrinking supply. While declining 3.3% from August, September’s sales spiked 21.1% annually. Billings, Mont., led the metro areas with a 37.1% surge from September 2019. San Francisco and Hartford, Conn., followed with gains of 34.7% and 33.3%, respectively.
The current conditions created a competitive landscape for homebuyers, keeping the lending and housing industries working at full speed in spite of the pandemic.
"Demand is
As inventory dried up, prices continued to climb. September's median sales price of $289,900 only fell $100 — 0.00035% — from August while jumping 12.8% year-over-year. The largest annual growth came at 25.1% in Augusta, Maine, 21.7% in Tulsa, Okla., and 21% in Indianapolis.
The frothy environment drove down the average time for listings to sit on the market to 39 days in September from 41 in August and 46 the year prior. Omaha and Cincinnati tied for fewest days at 17, with Nashville, Tenn., trailing in third at 21 days. Miami's average of 92 days had the longest listing time, followed by 90 days in Des Moines, Iowa, and 79 days in New York.


