More than three-quarters of 575 U.S. counties analyzed were less affordable than their historical average in the fourth quarter, as prices continue climbing to new highs, Attom Data Solutions found.
The 77% share of counties where prices were above historical affordability is a 13-year high, Attom said. This compared with 74% in the third quarter and just 39% for the fourth quarter of 2020.
Median single-family home prices in the fourth quarter were up by at least 10% on a year-over-year basis in 368, or 64%, of counties analyzed.
Meanwhile, home prices appreciated faster than weekly wage growth for 78% of the counties examined.
Data was analyzed for counties with a population of at least 100,000 and at least 50 single-family home and condo sales in the fourth quarter, Attom said.
Houses are still affordable for the average wage earner, but higher prices and

"Historically low rates and rising wages are still big reasons why workers can meet or come very close to standard lending benchmarks in a majority of counties we analyze," Tata said in a press release. "But the portion of wages required for major ownership expenses nationwide is getting closer to levels where banks become less likely to offer home loans."
The median national home price has shot up 17% over the past year to a record high of $317,500, Attom found.
However, ownership costs for median-priced homes took less than 28% of the average local wages in 296 of the 575 counties analyzed, 51%, about the same as in the third quarter for the same group of counties, but down from about two-thirds in the fourth quarter of last year. This calculation takes into account a borrower making a 20% down payment and uses the 28% front-end
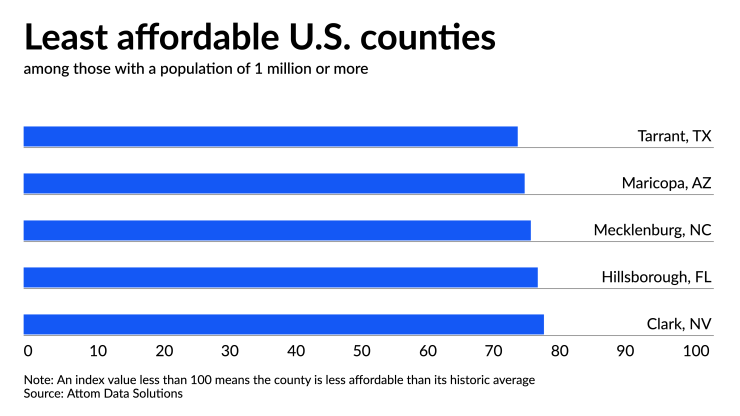
The least affordable counties based on their historical average with population over 1 million in the fourth quarter were led by Tarrant County (Fort Worth), Texas. Next was Maricopa (Phoenix), Arizona; Mecklenburg (Charlotte), North Carolina; and Hillsborough (Tampa), Florida. All are considered as
At the other end of the scale, New York City's Manhattan borough, also known as New York County, was the most affordable county compared with its historical average in the fourth quarter.
Separately Redfin, which has data that looks back at the four-week period ended Dec. 26, puts the median home sales price at $361,171, up 14.6% over the same period in 2020.
New listings and
"We see this slowdown as a temporary consequence of the holidays, and not as an indication that homebuyer demand is backing off," Taylor Marr, Redfin's deputy chief economist, said in a press release. "Those who did purchase homes over the holidays paid high prices due to the ongoing supply shortage."
At the same time, active listings — the number of homes listed for sale at any point during the period — fell 26.1% year over year to an all-time low, Redfin said. Compared with the pre-pandemic year of 2019, they were down 44.8%.
The average sale-to-list price ratio, which measures how close homes are selling to their asking prices, was 100.4%. During the four-week period, the median asking price for newly listed homes increased 12.9% from the prior year to $345,348.
Meanwhile,
The median time on market shrunk to 26 days, compared with 33 days in 2020 and 50 days in 2019.


