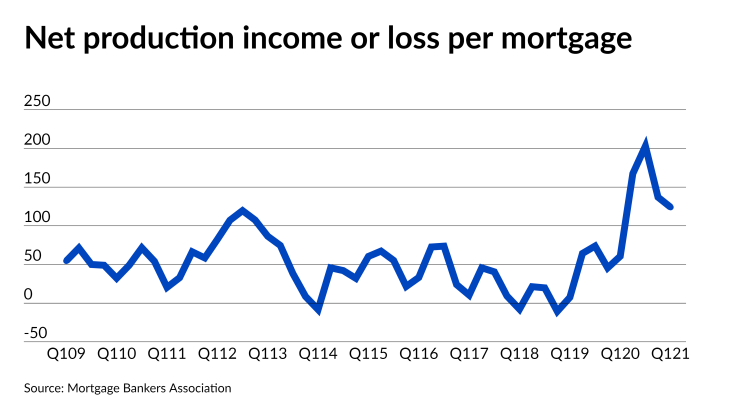
Home lender profits in the first quarter fell from
Lenders generated a net gain of $3,361 or 124 basis points of the principal balance on each loan they originated during the period. That’s down from $3,738 or 137 basis points during the previous fiscal period, but it’s still
In the history of the MBA’s survey, which dates back to 2008, mortgage lenders typically have made 55 basis points of profit on each loan on average; and at only one other point prior to 2020 did profitability climb into the triple-digits. That was during the 2012 refinancing boom. Profitability peaked at nearly 120 basis points at that time.

In other words, the takeaway from the most recent round of profitability numbers is that they’ve become only “a little less spectacular” than they were the previous quarter, Marina Walsh, vice president of industry analysis at the Mortgage Bankers Association, said in an interview.
“Keep in mind, we're at 124 basis points, so we have a ways to go before reaching even normal levels,” Walsh said.
Market indicators to date suggest that per-loan profits could continue to decline slowly, while remaining historically strong.
The MBA is forecasting that overall production will drop slightly in the second quarter to $1.05 trillion from $1.09 trillion in the previous fiscal period. Average production volume for an individual company was $1.44 billion or 4,879 loans in the first quarter, compared to $1.47 billion or 5,049 units in the previous one.
Purchase share did decline during the first quarter to 39% from 43%, likely due in part to seasonal weakness in the housing market during the period. However, the purchase market typically strengthens in the second quarter and has been particularly hot recently due to high household formation rates and
Purchase loans generally require higher expenditures than refinances so a rise in production expenses is likely when the second quarter numbers come out. Even during the first quarter, when purchases were weaker, production expenditures rose slightly to $7,964 per loan from $7,938 during the previous fiscal period.
Those numbers show that not only have profits been historically high recently, expenses have been high, too. The average for expenses during the MBA’s survey period is $6,621 per loan. The MBA includes commissions, compensation, occupancy, equipment, corporate allocations and other expenses in its calculations for that figure.
Even though the origination numbers were generally slightly weaker for the first quarter, the percentage of mortgage companies with pre-tax net financial profits from their servicing and production operations combined increased to 97% from 95%. Net financial income from servicing rose to $154 per loan in the first quarter, compared to $5 per loan during the previous fiscal period.
The MBA’s numbers reflect the results of independent mortgage banks and home lending subsidiaries of chartered banks.


