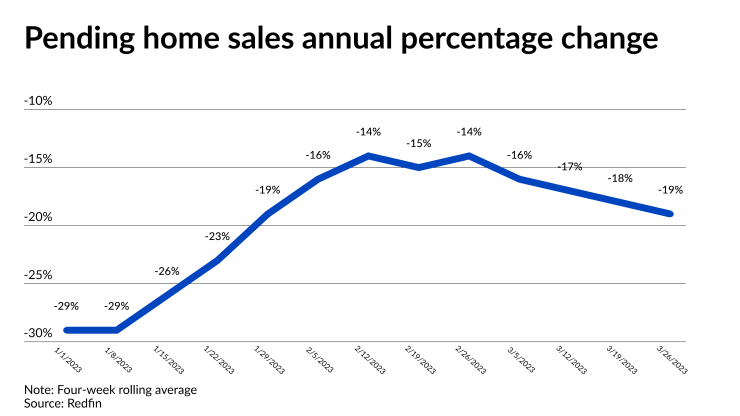
While more consumers are making moves toward purchasing a home, with one measure of that at the highest level since last May, the number is still well below one year ago, Redfin said.
Its Homebuyer Demand Index, a seasonally adjusted measurement of requests to tour homes, make an offer and/or talk to a Redfin agent about a home search, was at 130.0 for the week of March 26, up by 6% from the prior seven day period. However on a year-over-year basis, this was off 24%.
One Redfin agent is seeing interest primarily coming from two groups: entry-level owner-occupants and
"
The average 41 basis-point drop in the
So far demand has not translated into any year-over-year growth in deals, according to Redfin's analysis of multiple listing service data. Pending sales also

Some other measures do show near-term increases but also bear out Redfin numbers that register an annual decline.
The National Association of Realtors'
A lack of supply may be one reason why. New listings are down 22%, according to Redfin, which said this is one of the largest declines since the start of the pandemic.
While there have been near-term supply pressures, inventory looks favorable compared to a year ago in some respects. Redfin calculated the four week rolling supply of homes available for sale was 2.8 months, down from 3.6 months for the same week in February. But this was up from 1.9 months one year ago.
Other Redfin numbers show the median home-sale price fell 1.8% on an annual basis to $360,500, marking the sixth straight week of year-over-year declines.
However, Redfin found exceptions in local markets. Prices increased in some, including Milwaukee, where they were up 14.1%; Fort Lauderdale, Florida, 8.5%; Virginia Beach, Virginia, 6.9%; West Palm Beach, Florida, 6.7%; and Providence, Rhode Island, 6.4%.
On the other hand, markets like Austin, Texas, market reported price drops. It experienced the largest at 15.1%. The next biggest annual declines occurred in four California cities: San Jose, 12.9%; San Francisco, 11.7%; Sacramento, 11.4%; and Oakland, 10.8%.
"Prices are still rising quickly in some places while they are down by double digits in big tech hubs," said Taylor Marr, Redfin deputy chief economist. "One thing that's true almost everywhere: It's difficult to find a desirable, well-priced home for sale, so offer and negotiation strategies differ depending on where you're looking."
To categorize the recent progression of price changes in local markets, Mark Fleming, chief economist at First American Financial, recently divided the 50 areas the company tracks into four categories in the company's Real House Price Index report: boom-bust; boom-no bust; no boom-bust; and no boom-no bust.
A market like San Jose fits into the third grouping, he said.
"While San Jose prices have declined the most from peak among the markets tracked, it was in the bottom 10 markets for pre-pandemic-to-peak growth," Fleming said in a press release. "Many of the markets with the largest price declines from peak, such as San Jose and San Francisco are also considered 'overvalued' markets, meaning the median existing-home sale price exceeded house-buying power in these markets pre-bust."
New York is the example of a no boom-no bust city, and he defined Phoenix as a boom-bust area. A market like Miami, which is part of the same broader metro area as Fort Lauderdale and West Palm Beach, is an example of a boom-no bust region.
"John Burns Real Estate Consulting national survey results from February indicate that the southern Florida housing market is holding up better than most of the country, in part, because of the prevalence of cash buyers, who are not deterred by rising mortgage rates, making demand more resilient," Fleming said.


