Want unlimited access to top ideas and insights?
The top five nonbank
Read more about the nonbank mortgage originators with the largest change in funded loans in 2023.
Source:
Nonbank mortgage originators with the largest change in funded loans
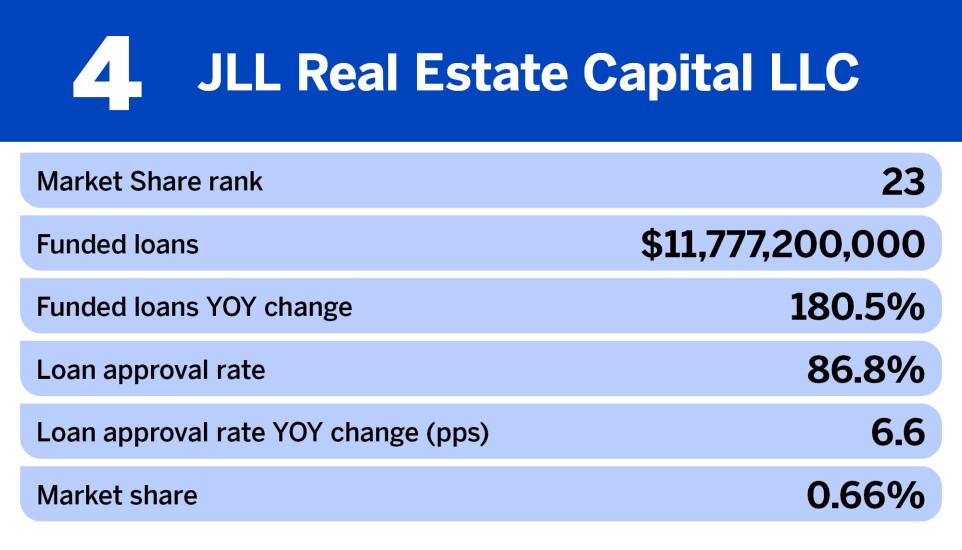
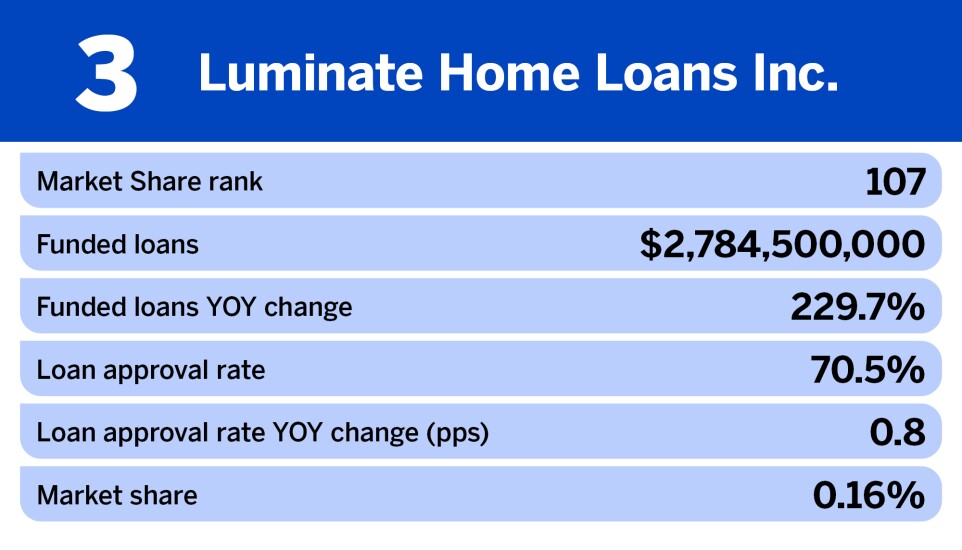
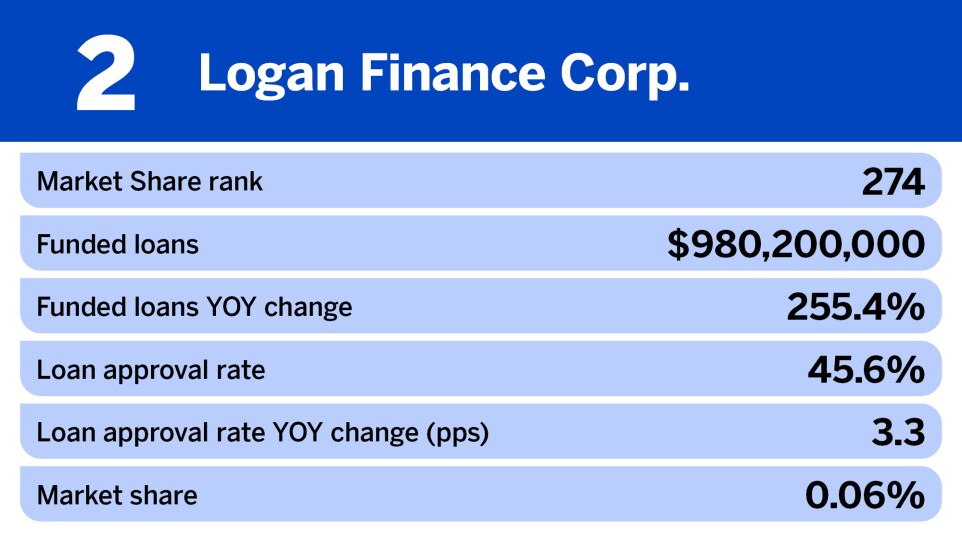
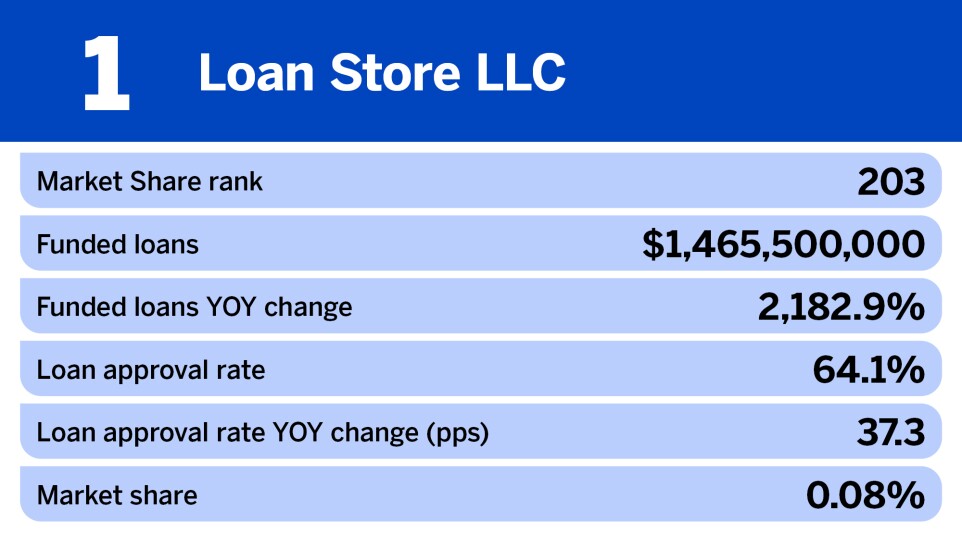
| Market Share rank | Company (top-level ticker) | Funded loans | Funded loans YOY change | Loan approval rate | Loan approval rate YOY change (pps) | Market share |
| 203 | Loan Store LLC | $1,465,500,000 | 21.83 | 64.10% | 37.3 | 0.08% |
| 274 | Logan Finance Corp. | $980,200,000 | 255.40% | 45.60% | 3.3 | 0.06% |
| 107 | Luminate Home Loans Inc. | $2,784,500,000 | 229.70% | 70.50% | 0.8 | 0.16% |
| 23 | JLL Real Estate Capital LLC | $11,777,200,000 | 180.50% | 86.80% | 6.6 | 0.66% |
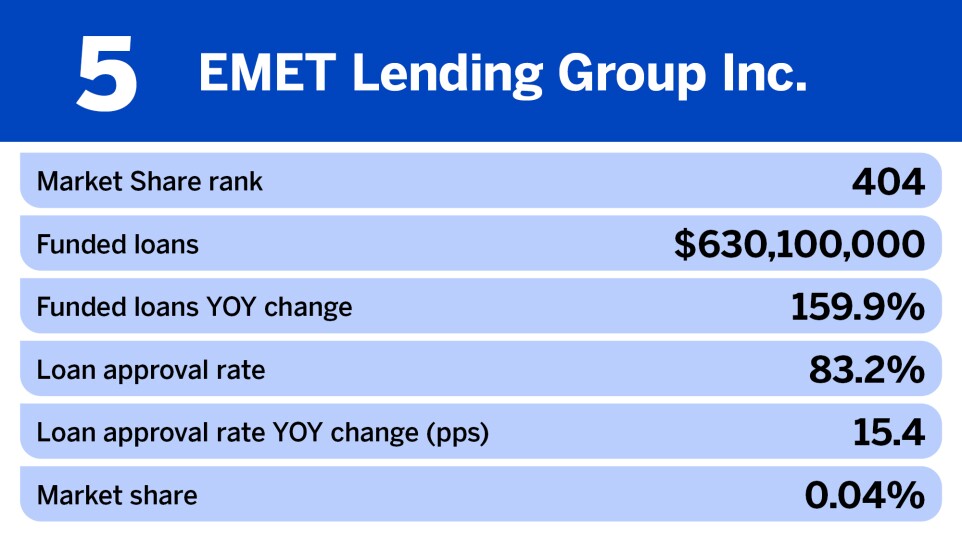
| 404 | EMET Lending Group Inc. | $630,100,000 | 159.90% | 83.20% | 15.4 | 0.04% |
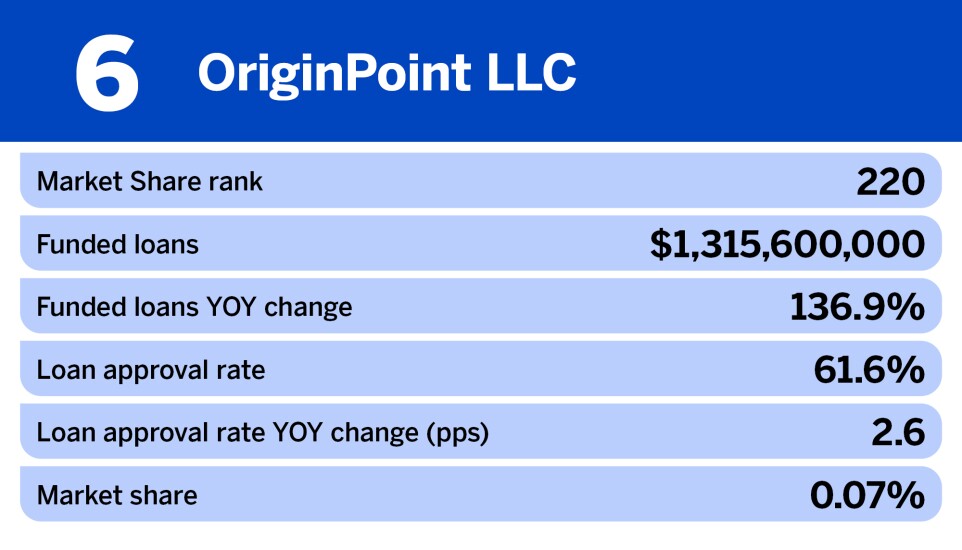
| 220 | OriginPoint LLC | $1,315,600,000 | 136.90% | 61.60% | 2.6 | 0.07% |
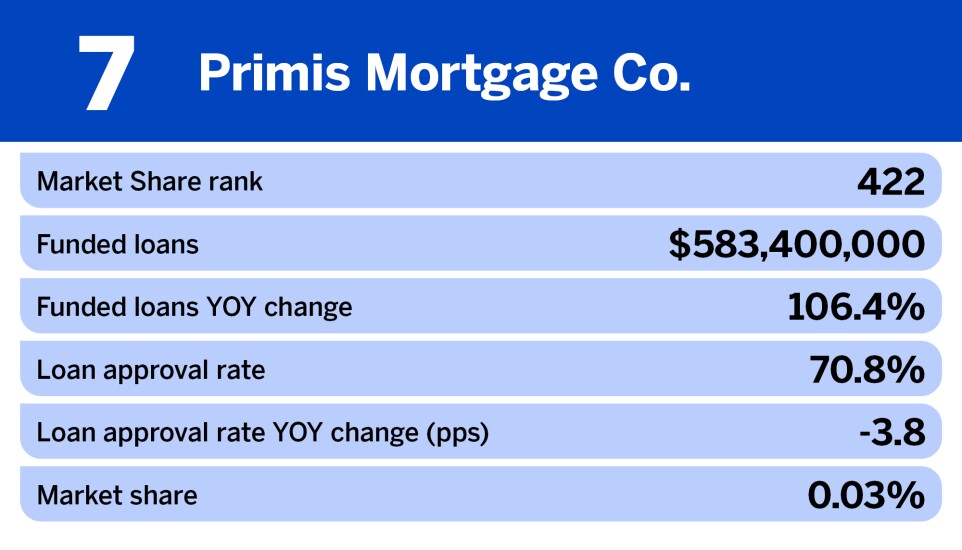
| 422 | Primis Mortgage Co. | $583,400,000 | 106.40% | 70.80% | -3.8 | 0.03% |
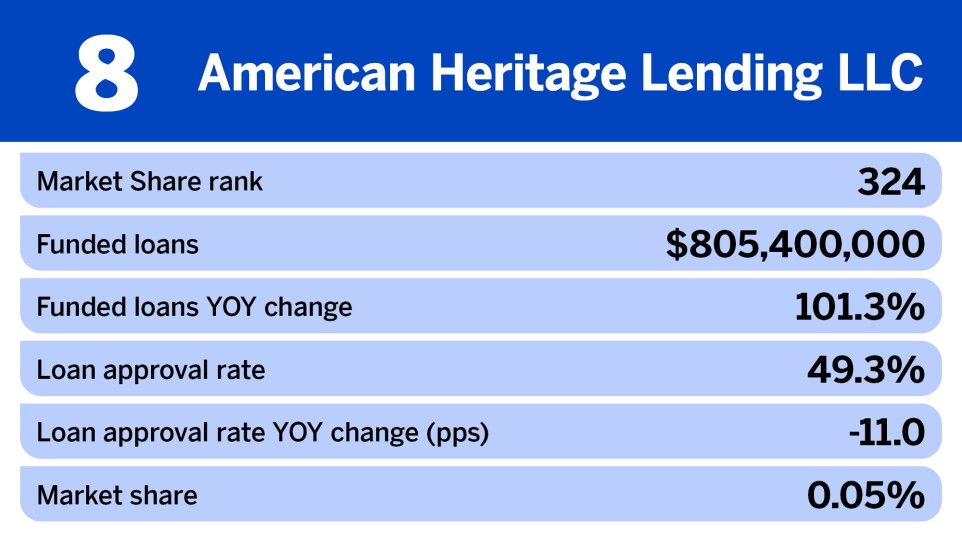
| 324 | American Heritage Lending LLC | $805,400,000 | 101.30% | 49.30% | -11 | 0.05% |
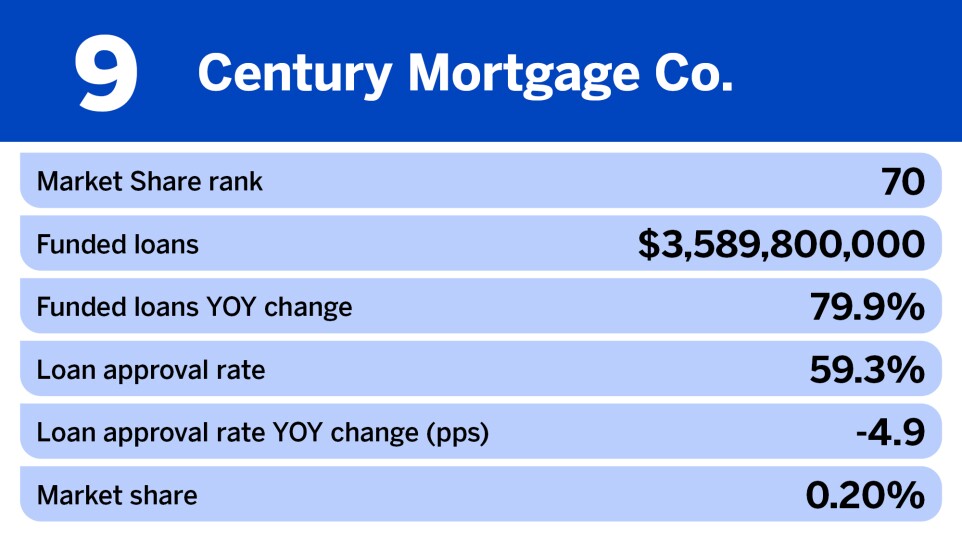
| 70 | Century Mortgage Co. | $3,589,800,000 | 79.90% | 59.30% | -4.9 | 0.20% |
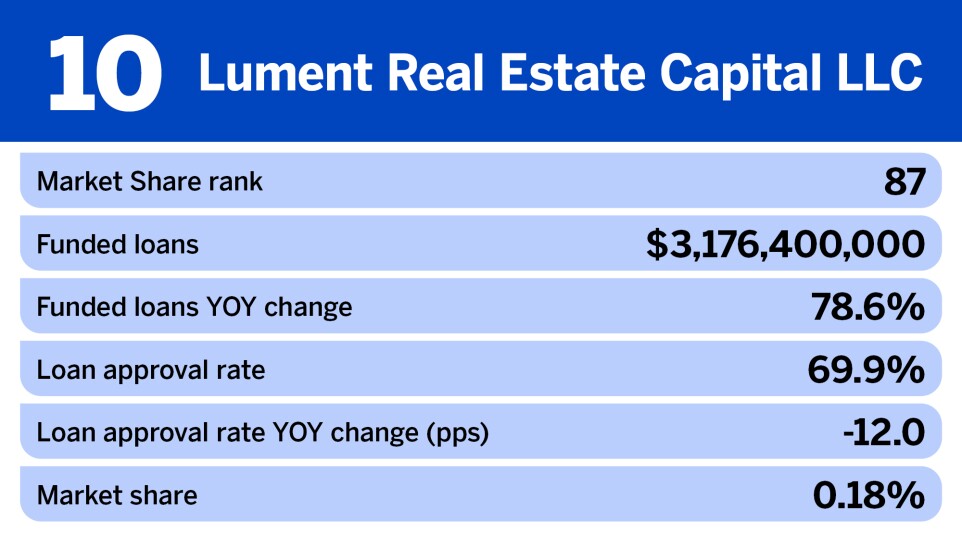
| 87 | Lument Real Estate Capital LLC | $3,176,400,000 | 78.60% | 69.90% | -12 | 0.0018 |
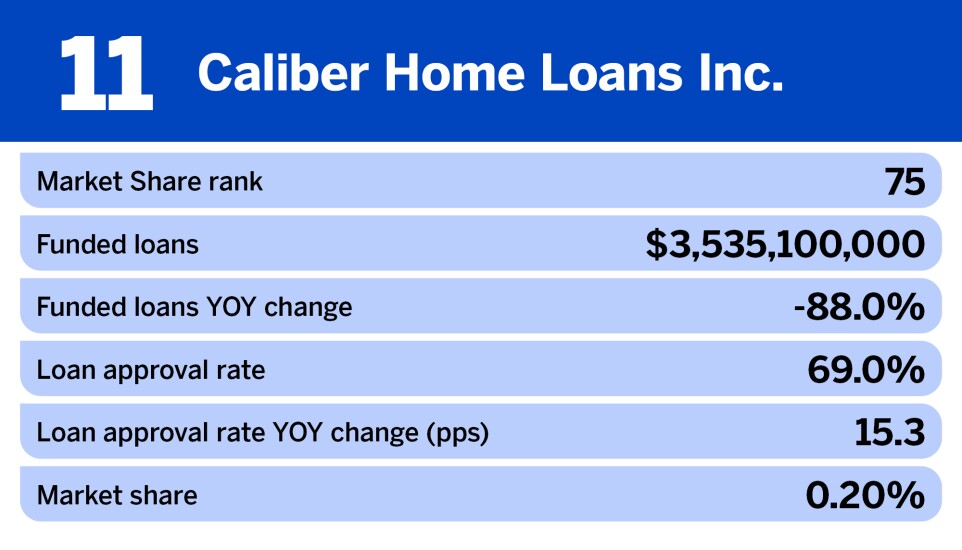
| 75 | Caliber Home Loans Inc. | $3,535,100,000 | -88.00% | 69.00% | 15.3 | 0.002 |
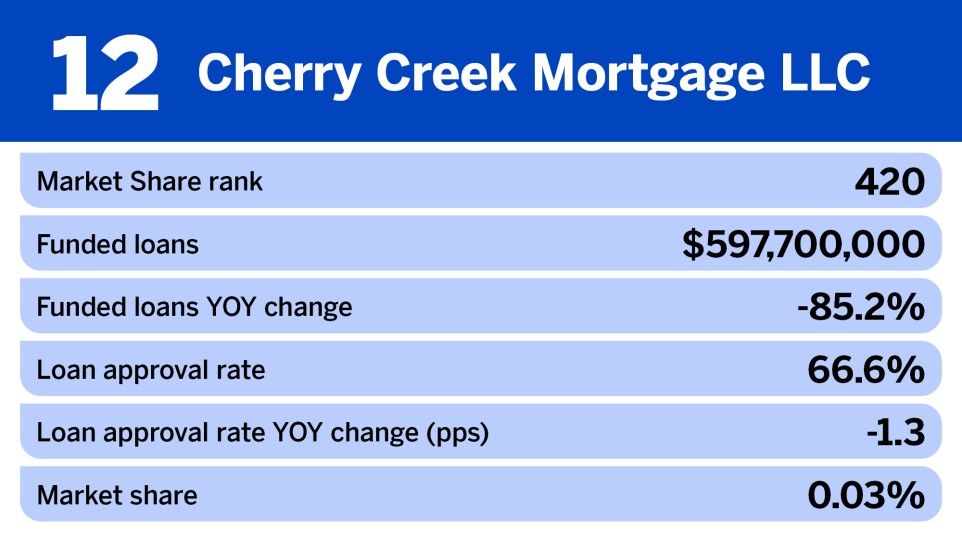
| 420 | Cherry Creek Mortgage LLC | $597,700,000 | -85.20% | 66.60% | -1.3 | 0.03% |
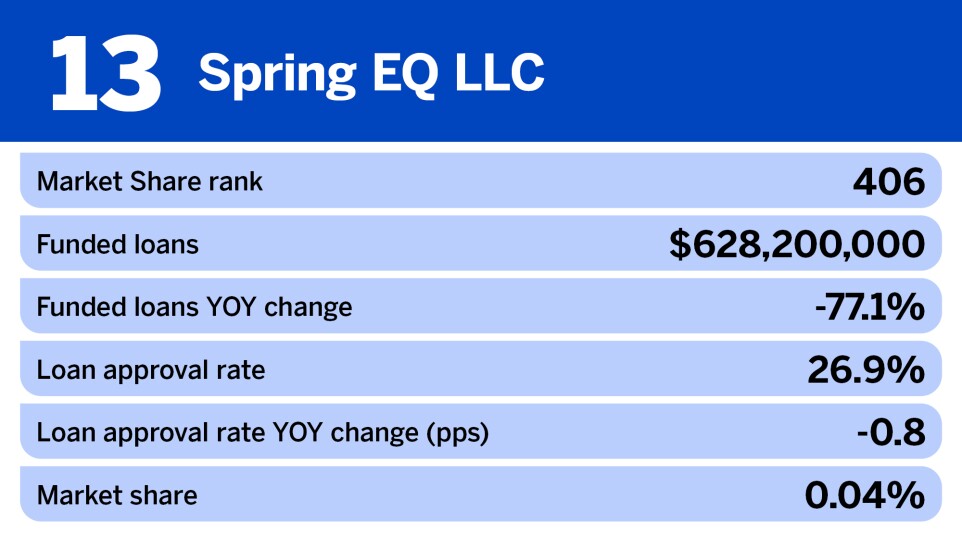
| 406 | Spring EQ LLC | $628,200,000 | -77.10% | 26.90% | -0.8 | 0.04% |
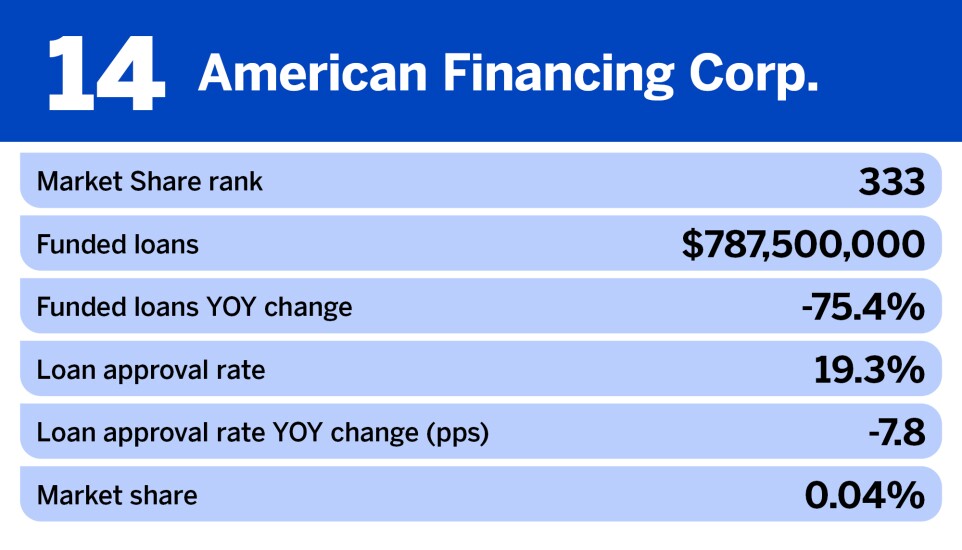
| 333 | American Financing Corp. | $787,500,000 | -75.40% | 19.30% | -7.8 | 0.04% |
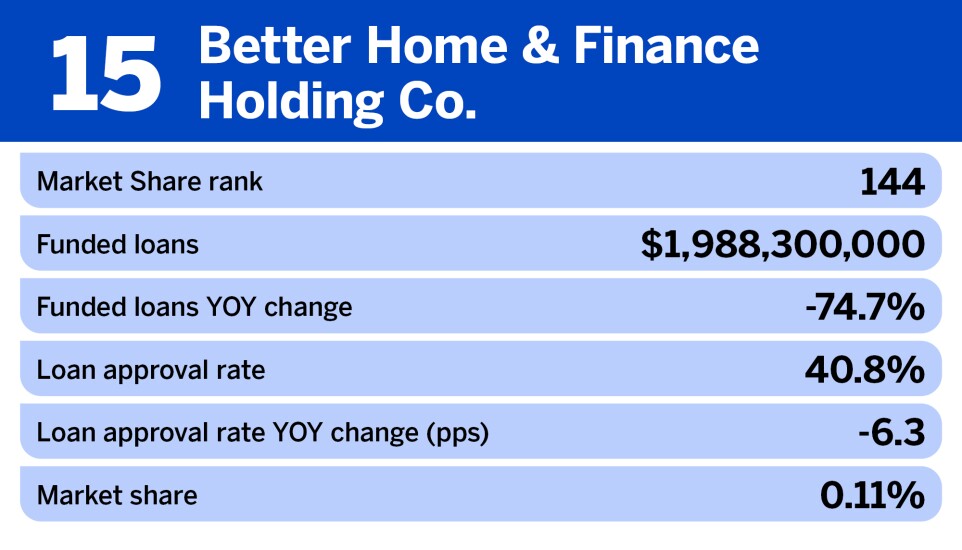
| 144 | Better Home & Finance Holding Co. | $1,988,300,000 | -74.70% | 40.80% | -6.3 | 0.11% |
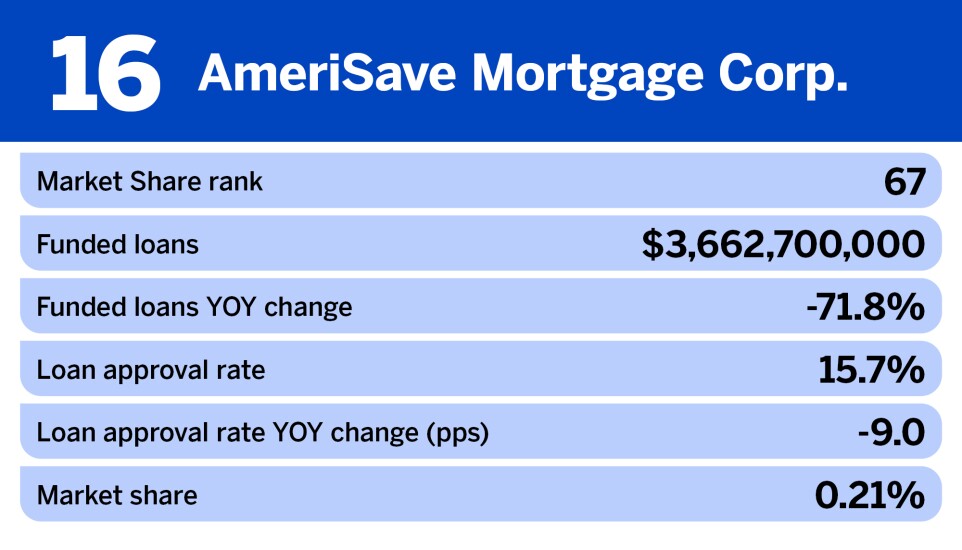
| 67 | AmeriSave Mortgage Corp. | $3,662,700,000 | -71.80% | 15.70% | -9 | 0.21% |
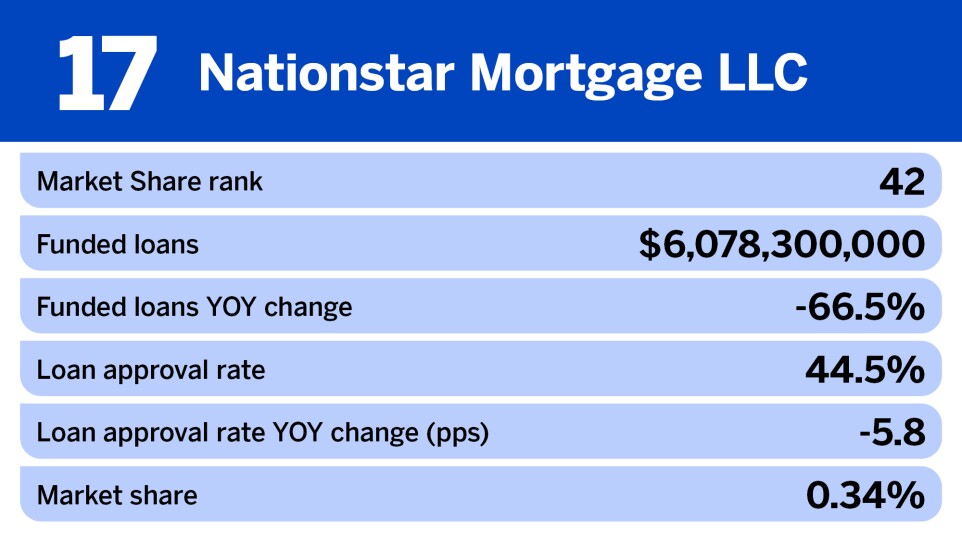
| 42 | Nationstar Mortgage LLC | $6,078,300,000 | -66.50% | 44.50% | -5.8 | 0.34% |
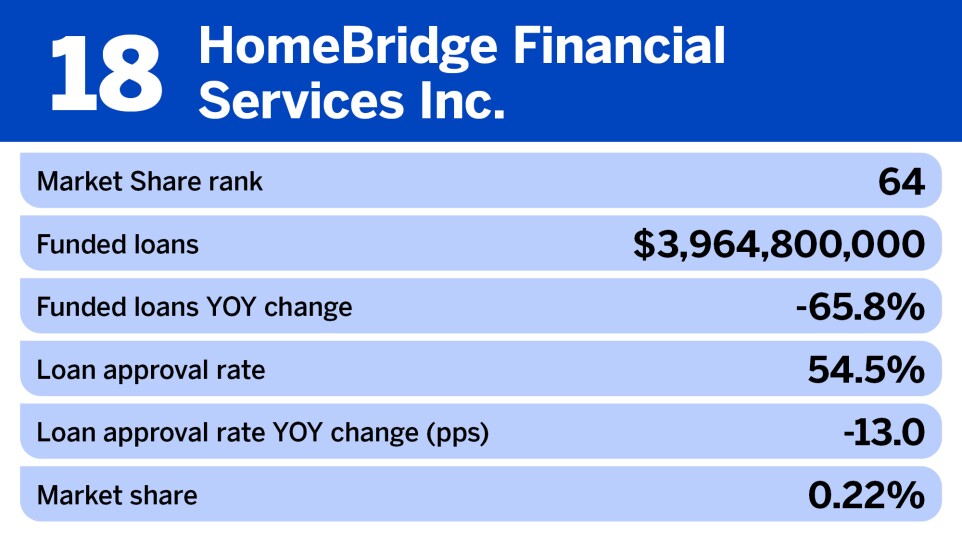
| 64 | HomeBridge Financial Services Inc. | $3,964,800,000 | -65.80% | 54.50% | -13 | 0.22% |
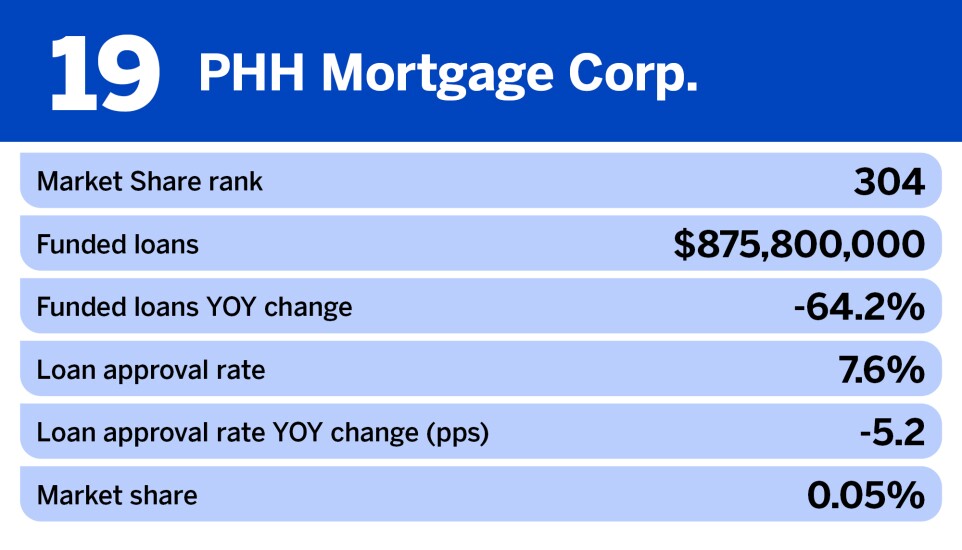
| 304 | PHH Mortgage Corp. | $875,800,000 | -64.20% | 7.60% | -5.2 | 0.05% |
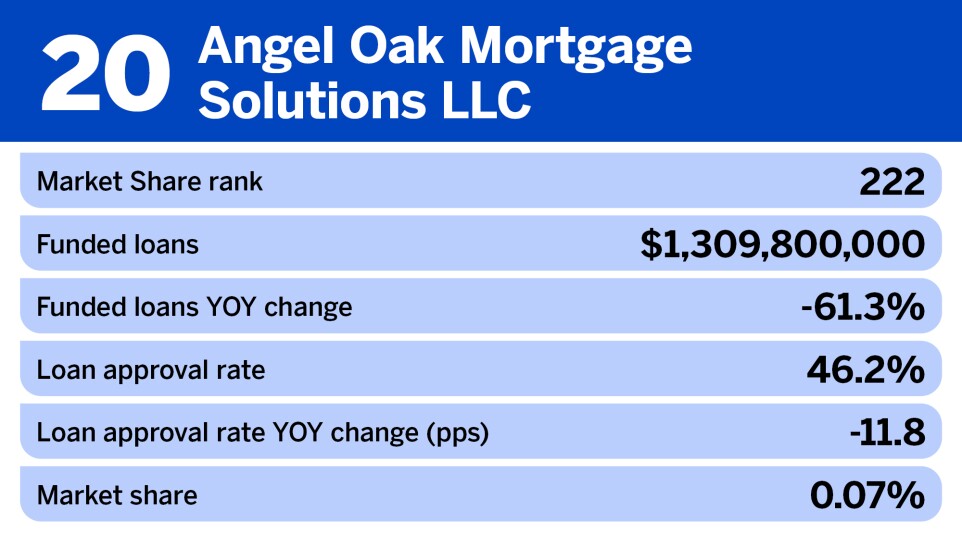
| 222 | Angel Oak Mortgage Solutions LLC | $1,309,800,000 | -61.30% | 46.20% | -11.8 | 0.07% |
