This
"We went looking for what is powering these modern American boomtowns. We found it is not just tech jobs, city size or affordability, even though those do help," Ralph DeFranco, global chief economist for Arch Capital Services, said in a press release. "We think it's encouraging that there are multiple routes to becoming a magnet for economic activity. Strong growth can come from a favorable business climate, a strong tech sector and, of course, some luck in being well located for today's growing industries and younger workers' desire for outdoor recreation."
The job market being a zero-sum game, meaning while some cities saw major growth, others merely had tepid progress.
"We also looked at the flip side — where new boomtown residents are typically moving from, namely areas that are economically weaker and have much less job growth," said DeFranco.
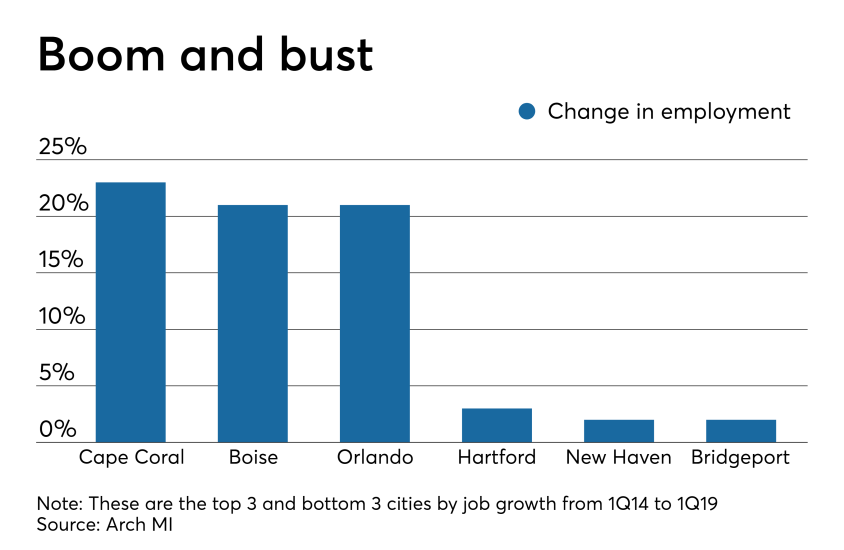
That flip side references seven of the top 100 housing markets that experienced employment growth of 3% or lower, with the bottom three all coming in the Nutmeg State. Bridgeport and New Haven both had a change of only 2%, followed by Hartford with 3%.
By contrast, the top metro areas had employment inflations of 20% or more. From the Carolinas to the Sunshine State, here's a look at cities offering the biggest job growth of the past five years.
Arch measured the 100 most populated metro areas in the country, using data from the U.S. Bureau of Labor Statistics. The cities were ranked by job growth from the first quarter of 2014 to the first quarter of 2019, factoring in influences on home buying job seekers under 45 years old.

No. 15 Charlotte, N.C.
Total 5-year employment increase: 173,000
Hypothetical median DTI ratio: 26%

No. 14 Charleston, S.C.
Total 5-year employment increase: 53,000
Hypothetical median DTI ratio: 29%

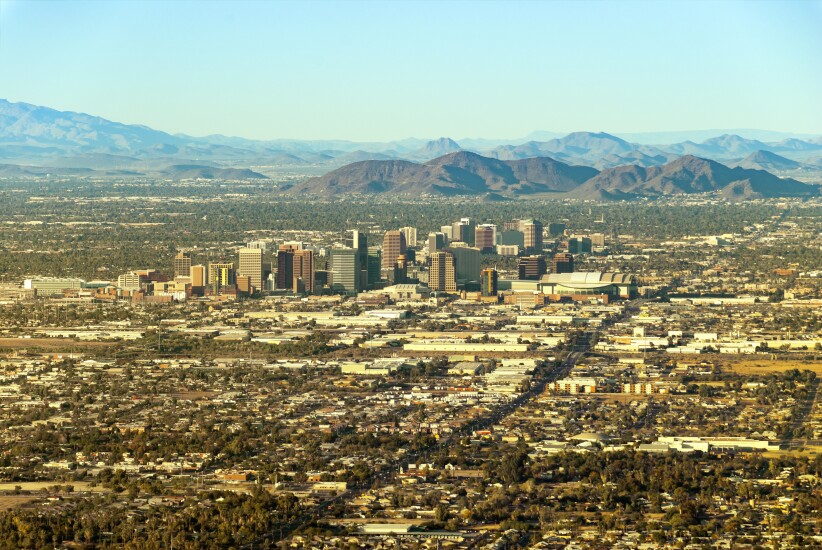
No. 13 Phoenix, Ariz.
Total 5-year employment increase: 310,000
Hypothetical median DTI ratio: 29%

No. 12 Ogden, Utah
Total 5-year employment increase: 39,000
Hypothetical median DTI ratio: 28%

No. 11 North Port, Fla.
Total 5-year employment increase: 46,000
Hypothetical median DTI ratio: 33%

No. 10 Fresno, Calif.
Total 5-year employment increase: 54,000
Hypothetical median DTI ratio: 33%

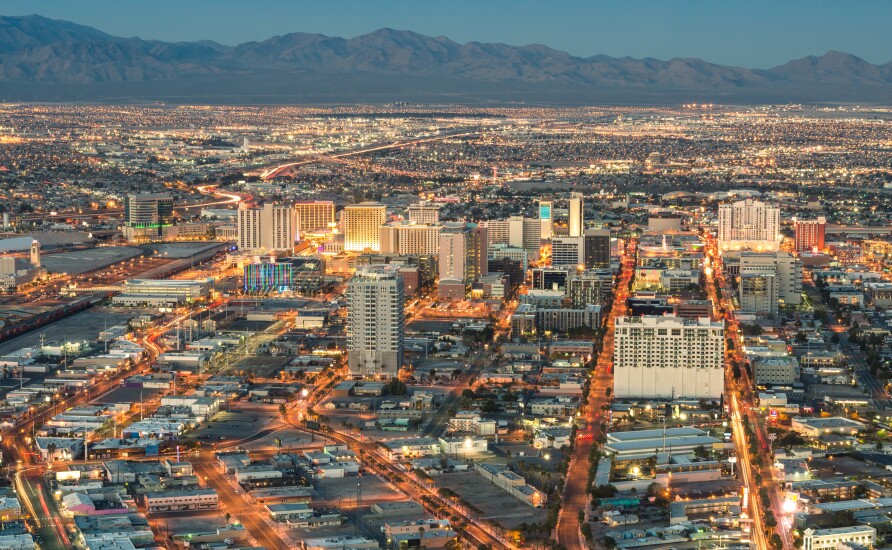
No. 9 Las Vegas, Nev.
Total 5-year employment increase: 155,000
Hypothetical median DTI ratio: 33%

No. 8 Dallas, Texas
Total 5-year employment increase: 409,000
Hypothetical median DTI ratio: 30%

No. 7 Austin, Texas
Total 5-year employment increase: 170,000
Hypothetical median DTI ratio: 31%

No. 6 Nashville, Tenn.
Total 5-year employment increase: 166,000
Hypothetical median DTI ratio: 26%

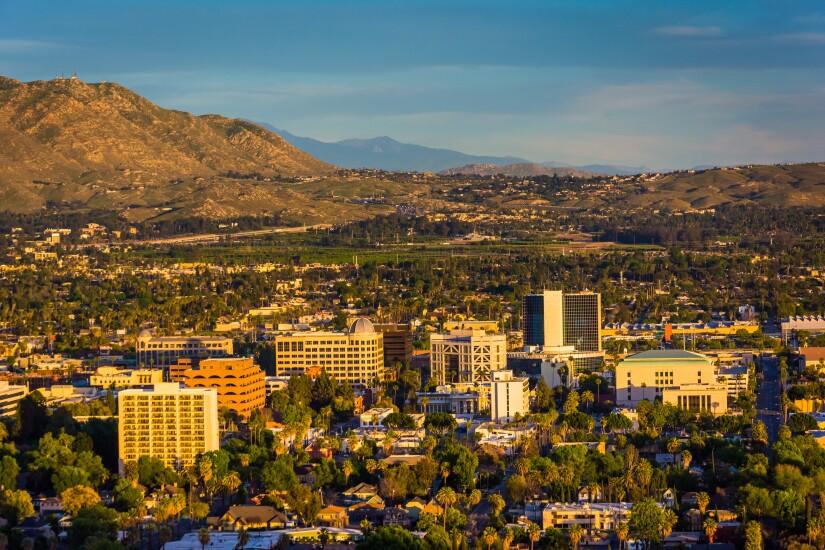
No. 5 Riverside, Calif.
Total 5-year employment increase: 245,000
Hypothetical median DTI ratio: 38%

No. 4 San Francisco, Calif.
Total 5-year employment increase: 192,000
Hypothetical median DTI ratio: 84%

No. 3 Orlando, Fla.
Total 5-year employment increase: 233,000
Hypothetical median DTI ratio: 32%

No. 2 Boise City, Idaho
Total 5-year employment increase: 60,000
Hypothetical median DTI ratio: 32%

No. 1 Cape Coral, Fla.
Total 5-year employment increase: 51,000
Hypothetical median DTI ratio: 31%


