Though property values did steady at the end of the year, they're up on an annual basis and expected to rise again as buyers battle over a limited supply of housing stock. Despite this, favorable conditions in certain local markets still offer consumers better purchasing power odds.
While in cities like Cleveland "real" house prices shot up 20% year-over-year in December, other areas saw such growth only reach about 5%, according to a First American Financial Corp. analysis of home values, factoring in local wages and mortgage rates in large cities.
From New York to Seattle, here's a look at 12 cities with the best purchasing power odds for the upcoming spring market.
The data, from the First American Real House Price Index, measures annual home price changes, taking local wages and mortgage rates into account "to better reflect consumers' purchasing power and capture the true cost of housing."
The December 2018 data is ranked by smallest year-over-year changes in RHPI for cities where the current value is less than 100 (an RHPI reading of 100 is equal to housing conditions in January 2000).

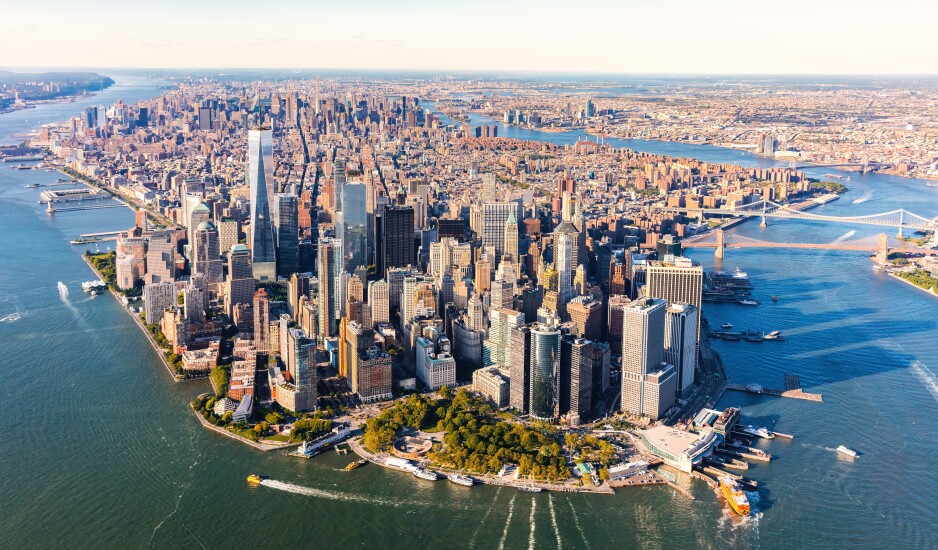
No. 12 New York, N.Y.
RHPI: 93
Median sale price: $404,163
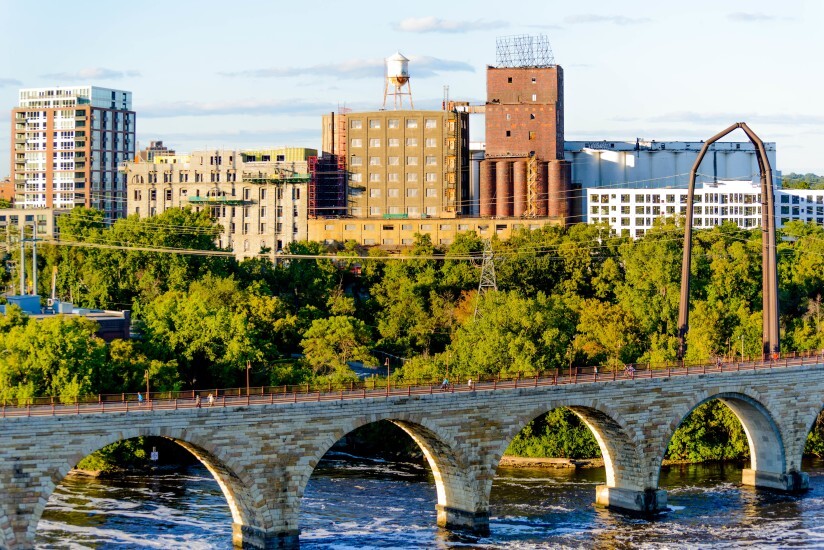
No. 11 Minneapolis, Minn.
RHPI: 94.85
Median sale price: $246,225
No. 10 Virginia Beach, Va.
RHPI: 99.75
Median sale price: $205,900

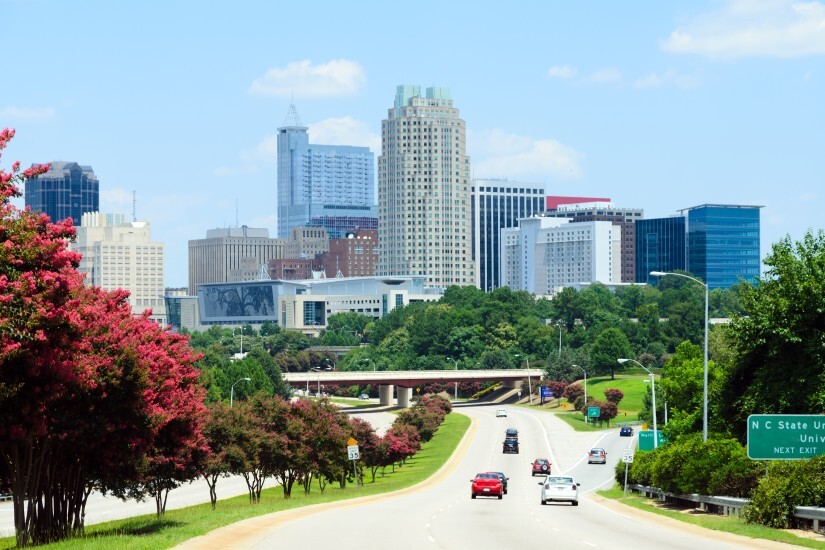
No. 9 Raleigh, N.C.
RHPI: 86.83
Median sale price: $242,625
No. 8 Pittsburgh, Pa.
RHPI: 68.53
Median sale price: $140,725

No. 7 Baltimore, Md.
RHPI: 86.93
Median sale price: $237,250

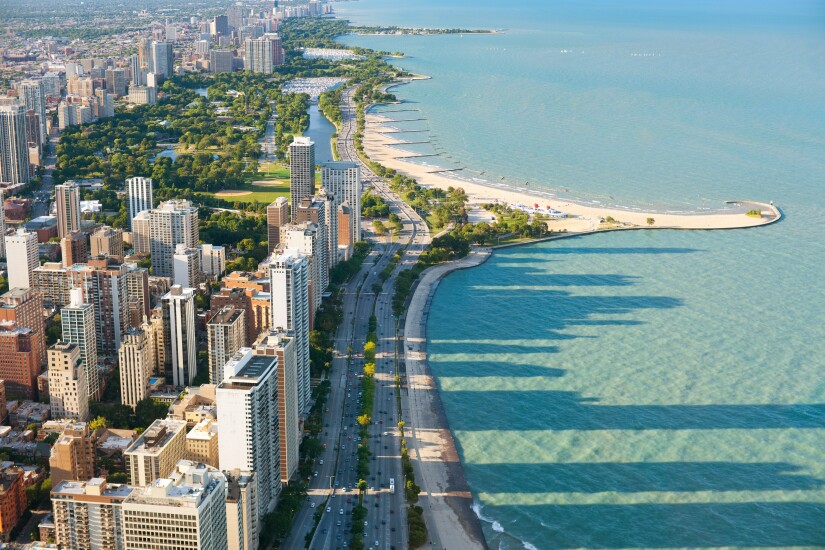
No. 6 Chicago, Ill.
RHPI: 71.21
Median sale price: $212,190
No. 5 Hartford, Conn.
RHPI: 76.10
Median sale price: $210,500

No. 4 Washington, D.C.
RHPI: 91.12
Median sale price: $370,227

No. 3 Oklahoma City, Okla.
RHPI: 73.91
Median sale price: $149,000

No. 2 Boston, Mass.
RHPI: 88.35
Median sale price: $438,286
No. 1 Seattle, Wash.
RHPI: 93.33
Median sale price: $451,894


