March's
"What began as a modest shift toward a buyers’ market in six cities last month has expanded into a national shift in affordability," Mark Fleming, chief economist for
However, not all cities are experiencing this shift. Some still have a gap between home prices and affordability. From secondary markets along the East Coast to the heart of the Midwest, here's a look at cities where consumers are losing ground in home buying power as summer approaches.
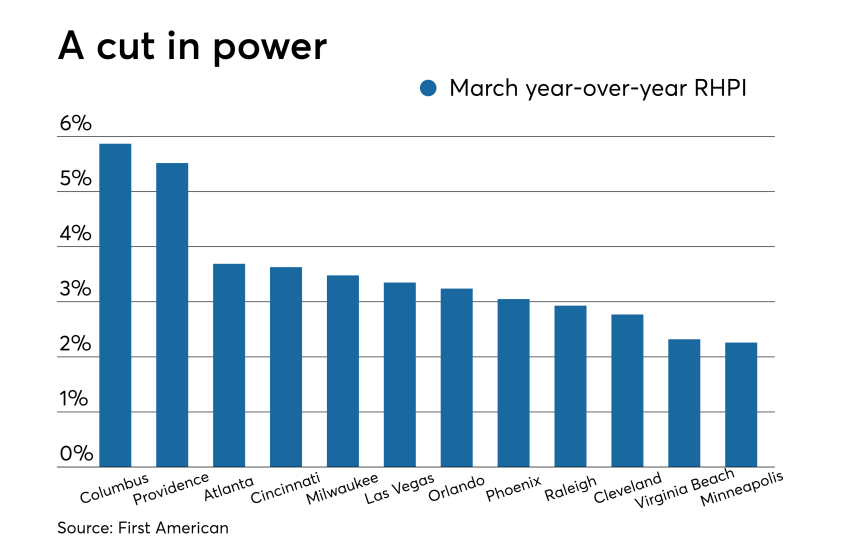
The data, from the First American Real House Price Index, measures annual home price changes, taking local wages and mortgage rates into account "to better reflect consumers' purchasing power and capture the true cost of housing."
The March 2019 data is ranked by the largest year-over-year changes in RHPI.

No. 12 Minneapolis, Minn.
RHPI: 89.94
Median sale price: $245,950

No. 11 Virginia Beach, Va.
RHPI: 90.65
Median sale price: $206,375

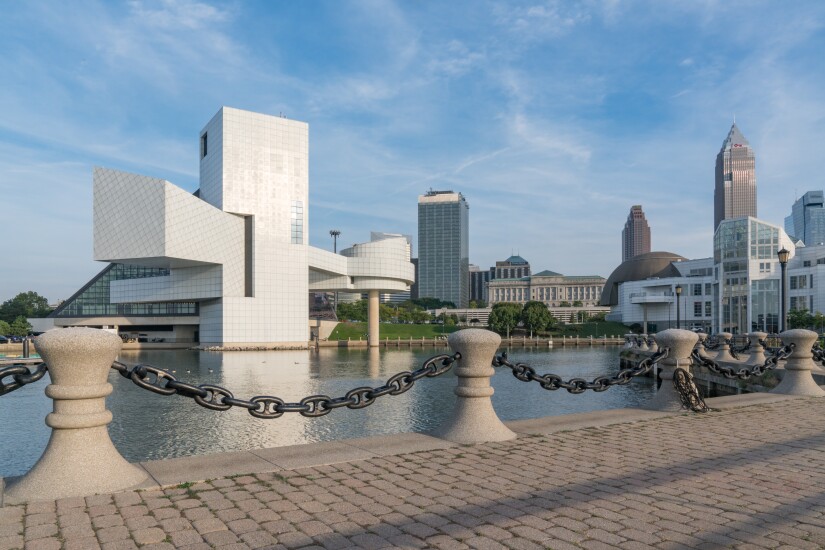
No. 10 Cleveland, Ohio
RHPI: 49.83
Median sale price: $131,750

No. 9 Raleigh, N.C.
RHPI: 81.48
Median sale price: $242,125

No. 8 Phoenix, Ariz.
RHPI: 88.72
Median sale price: $251,038

No. 7 Orlando, Fla.
RHPI: 94.06
Median sale price: $218,750

No. 6 Las Vegas, Nev.
RHPI: 83.17
Median sale price: $268,825

No. 5 Milwaukee, Wis.
RHPI: 93.67
Median sale price: $175,038

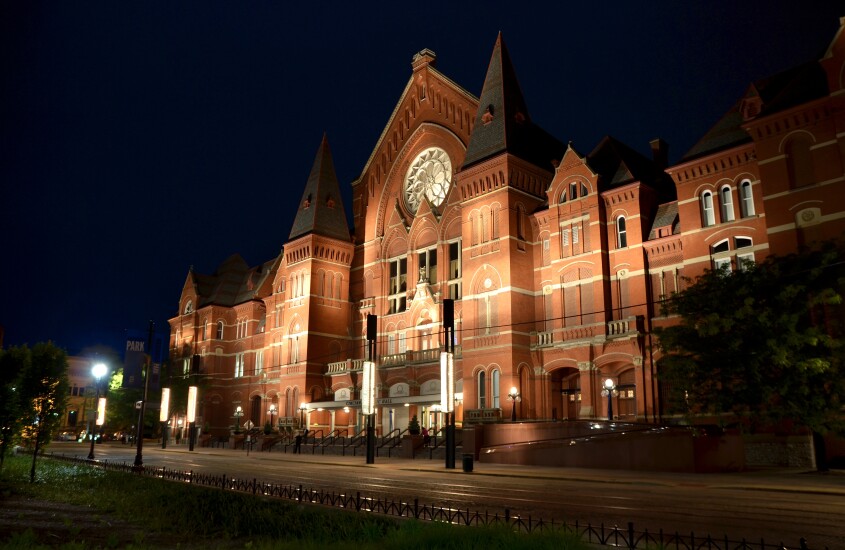
No. 4 Cincinnati, Ohio
RHPI: 64.61
Median sale price: $144,375

No. 3 Atlanta, Ga.
RHPI: 72.08
Median sale price: $196,914

No. 2 Providence, R.I.
RHPI: 94.90
Median sale price: $258,488

No. 1 Columbus, Ohio
RHPI: 60.29
Median sale price: $179,575


