The burst of the housing bubble drove the American economy into the depths of the Great Recession. In the decade since, housing recovered to various degrees, with average home prices nationwide appreciating at steady rates.

While many markets finished the decade in a much better place than where they started, home prices in some metro areas remain far behind those healthier ones.

Recovery levels diametrically split between the coasts, with the biggest coming out West and the East struggling. Further, home prices in 21 of the 100 largest metro areas still failed to attain their pre-recession high water marks.

From the Mid-Atlantic to across the Northeast, here's a look at the 10 housing markets with the worst percentage price recoveries following the housing crisis, according to SmartAsset.

For the analysis, SmartAsset took the Federal Housing Finance Agency's quarterly House Price Index for the 100 most populated metro areas from 2000 through the third quarter of 2019. Then, it identified the peaks and troughs and ranked the cities by price growth from each individual low point.
NMN01272020-smartasset.png

No. 10 Baltimore, Md.

Price index growth from housing crisis trough to 3Q 2019: 27.3%
Precrisis peak to trough: -23.4%
Crisis trough: 3Q 2011
NMN021219-baltimore.jpg
Colorful row houses along Guilford Avenue in Charles Village, Baltimore, Maryland.
jonbilous - stock.adobe.com

No. 9 Wilmington, Del.

Price index growth from housing crisis trough to 3Q 2019: 26.9%
Precrisis peak to trough: -23.9%
Crisis trough: 1Q 2012
Aerial of Wilmington Delaware
Jin - stock.adobe.com

No. 8 Newark, N.J.

Price index growth from housing crisis trough to 3Q 2019: 26.7%
Precrisis peak to trough: -23.7%
Crisis trough: 1Q 2012
NMN121917-newark.jpg
Newark, New Jersey, USA skyline on the Passaic River.
SeanPavonePhoto - stock.adobe.com

No. 7 Allentown, Pa.

Price index growth from housing crisis trough to 3Q 2019: 26.2%
Precrisis peak to trough: -25.7%
Crisis trough: 4Q 2011
allentown-pa-aerial-view-1.jpg

No. 6 El Paso, Texas

Price index growth from housing crisis trough to 3Q 2019: 21.7%
Precrisis peak to trough: -14.3%
Crisis trough: 2Q 2011
NMN082018-el-paso-texas
Jeff Schultes/Jeff Schultes - stock.adobe.com

No. 5 Albany, N.Y.

Price index growth from housing crisis trough to 3Q 2019: 19.2%
Precrisis peak to trough: -8.5%
Crisis trough: 3Q 2011
Albany, N.Y.
Ritu Jethani - stock.adobe.com

No. 4 Camden, N.J.

Price index growth from housing crisis trough to 3Q 2019: 17.4%
Precrisis peak to trough: -26.9%
Crisis trough: 2Q 2012
NMN121917-camden.jpg
viii - stock.adobe.com

No. 3 Bridgeport, Conn.

Price index growth from housing crisis trough to 3Q 2019: 15.5%
Precrisis peak to trough: -24.6%
Crisis trough: 4Q 2011
Bridgeport, Conn.
Trudy - stock.adobe.com

No. 2 New Haven, Conn.

Price index growth from housing crisis trough to 3Q 2019: 13.6%
Precrisis peak to trough: -24.1%
Crisis trough: 4Q 2012
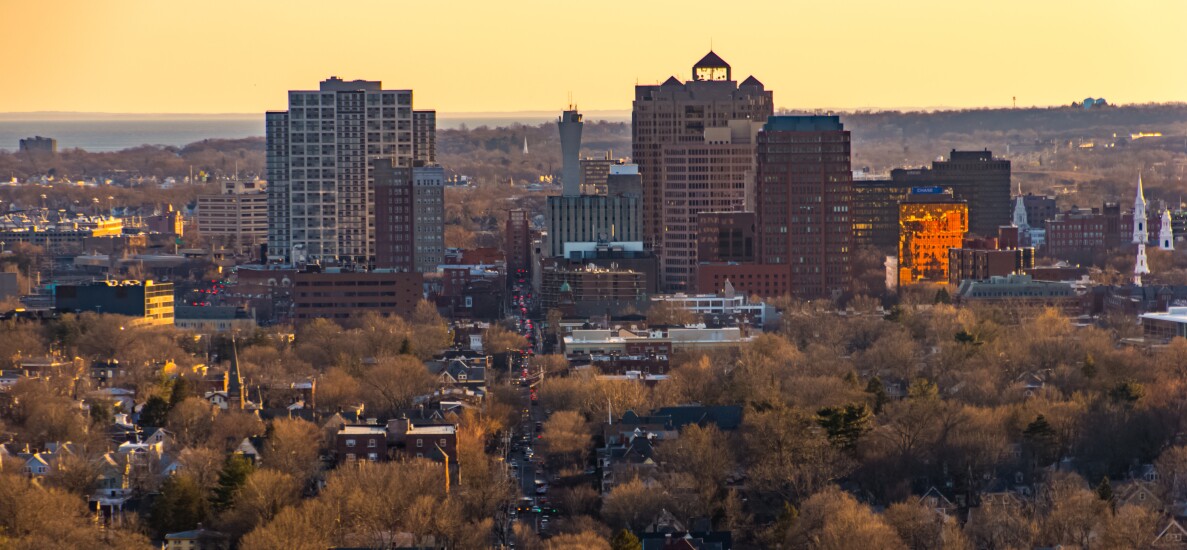
New Haven, Conn.
Nicholas Krotki - stock.adobe.com

No. 1 Hartford, Conn.

Price index growth from housing crisis trough to 3Q 2019: 10.4%
Precrisis peak to trough: -16.5%
Crisis trough: 1Q 2012
NMN031119-Hartford.jpg
MORE FROM NATIONAL MORTGAGE NEWS